Bhawna Mangla, professional headshot

Product Manager · 0→1 Systems & AI Products · Gurugram, India

Builds what
she learns.

I'm a Product Manager with 4+ years of experience — spanning telecom engineering at Ericsson to 0→1 fintech systems at Bajaj Finserv — turning complex processes and business problems into products that make work simpler and deliver measurable results. I like going beyond "what should we build?" to understand why a problem exists and what the data actually says.

I'm currently looking for my next Product Manager role, where I can bring my fintech experience, product thinking, and growing expertise in AI and Travel Tech to build products that people genuinely find useful.

01

About

// the throughline

I've always been curious about how things work.

I studied Information Technology (B.Tech, Jaypee University of Information Technology, Solan) and later went back for an MBA in Business Analytics (Amity University) to pair the engineering foundation with a business lens.

I started my career as an engineer at Ericsson, working on a telecom programme in Vietnam. That's where I got my first real exposure to systems operating at scale, and also learned that what looks simple on paper can get surprisingly complicated in the real world.

Eventually, I found myself more interested in the problem behind the system than just the system itself.

  • Why are people doing this manually?
  • Why does this handoff take so long?
  • Why are users dropping off here?
  • Can we make this simpler?

That curiosity is what took me from engineering into product.

Since then, I've worked across telecom (Ericsson), fintech (Bajaj Finserv), digital growth (Leading Edge Info Solutions), and design operations (Smartsites — UIUX Studio). The industries and companies have changed, but I've noticed a pattern in the problems I enjoy solving.

Something is usually more complicated than it needs to be.

  • A spreadsheet has become a business process.
  • A manual task has become someone's full-time job.
  • A team is working around a broken workflow instead of fixing it.
  • A customer is doing five steps when the product could do two.

I enjoy getting into those problems, talking to the people experiencing them, understanding what's really happening, and then figuring out what we can change.

Sometimes that means building a new product. Sometimes it means redesigning a workflow. Sometimes it means automating something that never should have been manual in the first place.

And now, with AI changing what products and teams can do, I'm particularly interested in building AI-enabled products — and, more recently, in Travel Tech — that use technology to remove complexity rather than add to it.

What I Believe

I don't think product management is about having all the answers.

For me, it's about asking better questions, staying close to the user, working well with people, and being willing to change your mind when the evidence says you should.

Understand the problem. Make it simpler. Build with purpose. Measure what changed.

That's the kind of product manager I'm trying to become.

Tools I work in, day to day

02

Impact Dashboard

// true, memorable, career-spanning
7d → 1d
FD booking turnaround (86% faster)
30%
Onboarding efficiency (FD Partner App)
10d → 2d
SmartSites project turnaround
Award ceremony stage with a screen reading: Congratulations Ms. Bhawna Mangla, Heroes Award, Exceptional Performance in FY'23, with recipients gathered on stage
Recognition
Heroes Award — Bajaj Finserv, FY'23
Company-wide recognition for performance impact.
03

Experience

// the shipping log
  • Sep 2025 — May 2026
    Product Manager
    Smartsites (UIUX Studio)
    → Product delivery, UX & AI-enabled workflows
    • Owned intake-to-delivery coordination across 30+ concurrent design projects with a 40-person team.
    • Introduced AI-assisted workflows, helping cut average project turnaround from ~10 days to ~2 days.
    • Cross-verified requirements with US-based PMs to close gaps and dependencies before execution.
    View detailed experience

    What I Owned

    • Translated client and PM requirements into clear briefs, priorities, deliverables, and acceptance criteria for design teams.
    • Cross-verified requirements with US-based PMs to identify gaps, dependencies, and scope changes before execution.
    • Managed prioritisation and delivery across 30+ concurrent projects, balancing timelines, capacity, and changing requirements.
    • Established recurring process syncs with the US team to identify bottlenecks and improve the delivery workflow.
    • Explored and introduced AI-assisted workflows and templates to reduce repetitive work across project intake and execution.
    • Helped reduce average project turnaround time from ~10 days to ~2 days through process optimisation and AI adoption.
    • Coordinated across Product, Design, and international stakeholders to maintain quality, timelines, and client expectations.

    Product / PM Skills

    Requirements Management Prioritisation Stakeholder Management Agile Delivery Process Optimisation AI Adoption Cross-functional Leadership
  • Sep 2024 — Dec 2024
    Chief Digital Growth Officer
    Leading Edge Info Solutions, Mohali
    → Digital growth, AI & team leadership
    • Led a 10-person cross-functional team delivering internal and client websites end-to-end.
    • Designed AI-assisted templates to close the Sales → Development handoff gap.
    • Conducted 20+ training sessions for 30+ employees on emerging digital and AI tools.
    View detailed experience

    What I Owned

    • Led a 10-person cross-functional team delivering internal and client websites from requirement gathering through development and launch.
    • Translated business requirements into actionable workflows, delivery plans, and priorities for the development team.
    • Identified process gaps between Sales and Development and designed AI-assisted templates to improve requirement handoffs.
    • Introduced AI-enabled workflows to reduce ambiguity, repetitive documentation, and communication gaps during project execution.
    • Conducted 20+ training sessions for 30+ employees on emerging digital and AI tools.
    • Identified skill gaps across teams and worked on capability-building initiatives aligned with business requirements.
    • Evaluated and negotiated PM/productivity tooling, achieving approximately 50% cost reduction.

    Product / PM Skills

    Product Discovery Requirements Definition Process Design Team Leadership AI Enablement Digital Transformation Stakeholder Management
  • Apr 2022 — Apr 2024
    Unit Manager — Product Management
    Bajaj Finserv
    → Product ownership & digital transformation
    • Led the product revamp of the Partner Portal, Customer Portal, and Partner Onboarding platform, driving adoption from ~5% to 45%+.
    • Redesigned Partner Onboarding, cutting turnaround from 7 days to 1 day (~85% faster).
    • Built and launched PCMS, integrating with Finacle to automate payouts for 5,000+ partners.
    View detailed experience

    What I Owned

    • Led the product revamp of the Partner Portal, Customer Portal, and Partner Onboarding platform, identifying friction points and translating business requirements into product improvements.
    • Managed the product lifecycle across discovery, BRD/PRD creation, prioritisation, sprint planning, UAT, release coordination, and post-launch tracking.
    • Worked with 35+ cross-functional stakeholders across technology, operations, business, compliance, and external partners to align requirements and delivery.
    • Improved the Partner Portal experience and drove digital adoption from ~5% to 45%+.
    • Ran the change-management side of that rollout — phased release, stakeholder communication across technology, operations, business, and compliance, and adoption tracking against that 5% to 45%+ curve.
    • Redesigned the Partner Onboarding journey, reducing turnaround time from 7 days to 1 day (~85% improvement).
    • Built and launched PCMS (Payout Calculation Management System), integrating with Finacle to replace a manual Excel-based payout process.
    • Automated partner payout workflows for 5,000+ partners, reducing manual effort by approximately 90%.
    • Improved Customer Portal self-service adoption across 50,000+ customers, contributing to a 40% increase in self-service transactions.

    Product Lifecycle Exposure

    Discovery → Requirement Definition → Prioritisation → UX/Workflow Design → Development → UAT → Launch → Adoption & Performance Tracking

    Tools / Methods

    Jira Azure DevOps BRD/PRD Agile/Scrum API & System Integrations Stakeholder Management Product Analytics
  • Jan 2021 — Apr 2022
    Domain Support Specialist
    Ericsson
    → Technical foundation & automation
    • Automated network restoration, health-check, and backup processes using Python and Shell scripting on Linux.
    • Supported infrastructure serving 1,000+ users, reducing restoration time from hours to minutes.
    • Improved network reliability by approximately 15% through automation and proactive monitoring.
    View detailed experience

    What I Worked On

    • Automated network restoration, health-check, and backup processes using Python and Shell scripting on Linux.
    • Analysed recurring operational issues and converted manual troubleshooting activities into automated workflows.
    • Supported infrastructure serving 1,000+ users, reducing restoration time from hours to minutes.
    • Improved network reliability by approximately 15% through automation and proactive monitoring.
    • Collaborated with technical and operations teams to troubleshoot incidents, identify root causes, and improve system reliability.

    Product-Relevant Strengths Developed

    Technical Problem Solving Automation Root Cause Analysis Systems Thinking Cross-functional Collaboration Process Improvement
  • 2024 — 2026
    MBA, Business Analytics
    Amity University · Correspondence

    A business lens layered on top of the engineering foundation below, in progress alongside full-time work.

  • 2016 — 2020
    B.Tech, Information Technology
    Jaypee University of Information Technology, Solan

    The engineering foundation, plus a running stack of AI product certifications since, applied immediately on live builds.

04

Case Studies

// dashboards, SQL, and product analytics — hands-on, not just claimed

A selection of product work that demonstrates how I approach the complete Product Management lifecycle: from identifying a problem and understanding users to defining strategy, prioritising opportunities, building solutions, launching products, and measuring impact.

My projects cover 0→1 product discovery, product strategy, user research, PRDs, prioritisation, UX, analytics, experimentation, AI-enabled products, and product optimisation. Some are product teardowns and strategic exercises, while others are products I've actually built and shipped.

What these case studies demonstrate

Discover → Define → Strategise → Prioritise → Design → Build → Launch → Measure → Iterate

Each case study focuses on the decisions behind the product: why a problem matters, what should be built, what should not be built, how success would be measured, and how the product could evolve.

My goal isn't to showcase a collection of screens or frameworks.

It's to show how I think as a Product Manager: connecting customer problems, business goals, data, technology, and execution to move a product forward.

Across the portfolio, you'll find real products, product teardowns, 0→1 concepts, analytics-driven improvements, and AI-enabled solutions, each demonstrating a different stage or combination of the Product Management lifecycle.

T42

LedgerLens — Bank Statement Analyzer (Credit Risk Lens)

3 interfaces, 1 shared engine — hosted page, local app, and CLI all produce identical output Now a real backend API: SQLite job storage, a fair multi-user queue, millisecond re-scoring on review 22 data-validation checks, built into the JSON output, not just a UI badge 109 automated tests, offline, run on every GitHub push — 0 API key needed A broken balance check forces REFER regardless of score — never a silent APPROVE A full product blueprint & MVP PRD — market research, personas, roadmap, 5 differentiating bets

Tools used: Node.js 18, pdf.js (digital-PDF text layer), Tesseract.js (OCR for scans/images), xlsx (Excel ingestion), SQLite (job/result storage), the Claude API via forced tool use for extraction and classification. Three shells — a hosted claude.ai Artifact (rules-only, since a static page can't hold an API key), a local Node backend (LLM-enabled, now with a REST API), and a CLI — all run the same pipeline, so the JSON a CLI run produces matches what the UI and the API show.

Executive summary

LedgerLens reads a raw bank statement and returns a 0–1000 credit-risk score, a decision, and the reasons behind it — automating the three things a credit officer does by hand (read the layout, judge what each transaction really is, catch tampering) without losing auditability. Rules classify first; an LLM only fills what rules can't; every model output is forced through the same balance check as the statement itself. A real multi-user backend (SQLite, job queue, instant re-scoring on review) and 109 automated tests are already built. Status: a tested proof of concept — the scoring model is not yet calibrated against real loan outcomes.

The Pipeline

StageWhat it does
1. Convertpdf.js text layer for digital PDFs; Tesseract OCR for scans/images; Excel sheets → CSV; password PDFs asked once, never stored
2. Validate orderChecks "Page X of Y" footers per file, or date continuity if there are none — stops cleanly on jumbled or missing pages instead of silently scoring a broken sequence
3. Batch extraction3 pages per batch; with the LLM on, one model call per batch returns structured rows, cross-checked against the rule parser and the running balance before being trusted
4. EnrichCounterparty parsing (mandatory — never blank), channel, IFSC→bank, merchant aliasing, foreign-currency fields — built from real Indian bank narration formats (HDFC, ICICI, SBI, Axis, Kotak, UPI/NEFT/RTGS/IMPS/NACH)
5. ClassifyA 37-category taxonomy, resolved in order: user rules → structural rules → narration keywords → LLM for leftovers → OTHER, with a confidence and method stored on every row
6. Score6 weighted components → a composite 0–1000 score, rating band, and decision, run against 22 data-validation checks

Backend API — Built for a Team, Not One Analyst

  • Persistent. Jobs are rows in SQLite, not in-memory state — a server restart loses nothing.
  • Isolated. Each job runs in its own worker process, so one stuck OCR page can't block anyone else.
  • Fair. The next job always comes from the user with the fewest jobs already running, not whoever queued first.
  • Instant correction. A reviewer's fix re-scores from a saved snapshot in milliseconds — no re-read, no OCR, no model call — with every prior version and a full audit trail retained.

Positioning Against a CIBIL Score

  • A CIBIL score shows whether someone has repaid credit before. LedgerLens shows whether they can afford a new loan today.
  • CIBIL can't see a salary that stopped last month; a statement can't see a loan already repaid elsewhere — lenders need both, and the app says so rather than positioning itself as a bureau-score replacement.
  • An in-app Knowledge Sharing tab explains the LLM's role, the scoring math (worked through on a real sample), and a 21-item FAQ for non-specialists.

Key Design Decisions

  • Rules first, model second, human last. Deterministic rules handle what's structured and auditable; the model only fills what rules can't; a human only sees what can change the decision.
  • Integrity over coverage. Balance arithmetic is checked on every row. A broken balance forces REFER regardless of score — never a silent APPROVE.
  • The model proposes, code verifies. Every LLM row must pass the same balance check as the statement; a failing batch retries once, then falls back to rules.
  • Not every credit is income. Only SALARY, BUSINESS_INCOME, INTEREST, and RENTAL_INCOME count — P2P, refunds, loan disbursals, and own-account transfers are excluded.
  • Decision = band + hard overrides. No verifiable income or FOIR above 65% forces DECLINE; tampering, structuring, or circular flows force REFER — every override's reason is listed.
  • Correction ≠ re-run. A reviewer's fix re-scores from a stored snapshot, not the raw file — fast, and every prior version stays readable.

Proof the Safety Net Works

FindingOCR misread ₹1,532.40 as ₹1,632.40 on a scanned test statement.
ResultThe balance check caught it. Decision forced to REFER (906) instead of a wrong APPROVE.
Why it mattersThe architecture's core guarantee held under a real failure, not just in a spec.

Testing Discipline

  • 109 automated tests, 0 API key required, run on every push.
  • A deliberately-wrong mock model (every balance off by ₹1,000) proves the fallback-to-rules path actually engages.
  • 18 tests exercise a live backend: a real SQLite database, 2 live worker processes, multi-user isolation, and fair scheduling.
  • 13 example statements, each checked against its own documented expected result.

Quick recall

SectionSummary
ProblemA credit officer reviewing statements by hand has to read inconsistent bank layouts correctly, judge what each transaction really is, and catch tampering/structuring — all without a system that's actually auditable for a lending decision.
Research stepsChose rules-first classification specifically because Indian bank narrations are semi-structured enough to make it viable → designed the LLM's extraction output to be forced through the same balance check as the statement itself, so a model error can never silently pass → built 13 example statements and 109 offline tests, including a deliberately-wrong mock model and a real backend run against a temporary database, to prove the guardrails actually engage rather than just existing on paper → caught a real OCR digit misread during testing and confirmed the safety net correctly forced REFER instead of a wrong APPROVE → wrote a full product blueprint and MVP PRD (market research, personas, roadmap, 5 differentiating bets) once the engine itself was proven.
SolutionA 6-stage pipeline (convert → validate order → extract → enrich → classify → score) now backed by a real multi-user API — SQLite job storage, a fair queue, millisecond re-scoring on review, and a full audit trail — sharing one engine across a hosted demo, a local LLM-enabled app, and a CLI.
ConclusionThe architecture, guardrails, and now the multi-user backend are real and tested end to end — but honestly, LLM accuracy still hasn't been measured on real (non-synthetic) statements, and the scoring weights remain illustrative, not calibrated against historical loan outcomes. A proof of concept that's grown real infrastructure, not yet a production credit model.

Which feature is used at which step

FeatureUsed at
Page-order validationRight after conversion, before extraction even starts — stops a jumbled or missing-page statement with a clear error instead of scoring a broken sequence
Running-balance cross-checkInside batch extraction — every LLM-returned row has to agree with the statement's own running balance, or the batch retries once then falls back to the rule parser
Mandatory counterpartyEnrichment — a row with no identifiable counterparty is never left blank; it falls back to UNIDENTIFIED and is always routed to the Review queue
Confidence + method per rowClassification — every row stores whether RULE, LLM, or MANUAL produced its category, and at what confidence, so a reviewer can see how a label was produced, not just what it is
Smart review triageBefore scoring — only high-impact flagged rows (large amounts, recurring payments, loan-related, possible bounces, no counterparty) reach a human; low-impact ones auto-accept
Hard policy overridesLast, after the composite score — tampering, structuring, no verifiable income, or FOIR above 65% can force REFER/DECLINE regardless of how high the score is
Review-decision re-scoringAfter a reviewer acts in the queue — re-scores from a saved snapshot in milliseconds, saves a new result version, and logs the change to the audit trail, all without touching the original file again
Fair job schedulingIn the backend queue, when multiple users submit jobs at once — the next job always comes from whoever has the fewest jobs already running, so one heavy user can't starve everyone else
T40

Merchant Payment Operations & Dispute Hub

17 real artifacts across 7 stages, discovery to post-launch 47-item backlog across 9 epics (252 MVP points); 24 requirements traced to 62 test cases + 9 compliance controls 3-scenario business case: base NPV $149k, conservative ($839k), optimistic $1.34M Simulation project — fictional merchants, figures and teams; not an actual client system

Tools used: Excel (live-formula workbooks), Word, PowerPoint, HTML (wireframes + interactive SQL lab), SQLite. Built with AI assistance for drafting, the same way I'd use it on real client work.

The Problem (Simulated)

Merchants handle card disputes by email and spreadsheets: deadlines tracked by hand, evidence emailed to dispute operations and re-keyed, nobody able to see where a dispute actually stands. In the simulated baseline: 78% of merchant responses arrive on time, and 9% of closed disputes are lost only because the deadline passed. Dispute operations spends 42 minutes handling each dispute, with 100% of evidence arriving by email — including card numbers sitting in attachments, a PCI DSS exposure. Finance and Operations calculate win rate differently: 40% vs. 62.5% on the same disputes.

The Solution

One portal where merchants see every dispute and its deadline, get reminders, upload evidence with card numbers auto-redacted, and understand how disputes affect their payouts. Behind it: processor integration, a prioritized ops work queue, and one agreed set of dispute numbers. Beyond the MVP, the roadmap differentiates through prevention and explainable AI — pre-dispute alerts, dispute-ratio health, an AI evidence copilot with human review, friendly-fraud evidence automation, and readiness for purchases made by AI shopping agents.

How I Approached It — 7 Stages

StageWhat I did
1. DiscoverBenchmarked American Express, Adyen, Stripe and Razorpay; logged findings, gaps and decisions with sources and status.
2. DefineWrote the PRD; built a 47-item backlog across 9 epics (252 MVP points); traced 24 requirements to 62 test cases and 9 compliance controls; defined 21 KPIs with outcome definitions.
3. DesignCreated 13 annotated wireframes: 8 MVP screens and 5 concept screens, with rules, edge states and open questions.
4. Plan & governOutcome-based roadmap (30 initiatives), RAID log, change control with impact assessments, stakeholder map, RACI and governance calendar.
5. Justify & launchThree-scenario business case, pilot-led go-to-market with KPI gates, launch readiness, hypercare, benefits tracking and BAU transition.
6. Communicate17-slide executive review ending in five explicit decisions.
7. MeasureSQL practice database with KPI, reconciliation and data-quality queries, including deliberately planted data problems.

Decisions Worth Discussing

  • Resolving a stakeholder conflict without escalating or giving in. The Fraud Operations Lead wanted full fraud case management in the MVP. I proposed a read-only fraud case reference in the MVP with a Phase 2 commitment (CR-01, Option C).
  • Fixing a metric before reporting it. Finance and Ops disagreed on win rate. The proposed definition reports Won, Partially won and Lost separately, with value recovery as the North Star (CR-05).
  • Tracing one risk end to end. Stale deadlines (R-03) → webhook assumption (A-02) → sandbox issue (I-01) → blocked story (US-019) → mapping defect (DEF-03) → failing requirement (BR-06) → latency KPI (KPI-12) → incident playbook (PB-02).
  • Showing a business case that can lose money. Base case NPV is $149k with a 2.3-year payback, but the conservative case is ($839k). That points leadership at the two assumptions that matter: merchant adoption and whether released ops capacity is cashable.
  • Exiting hypercare on evidence, not a date. Twelve exit criteria, including 10 business days without a Sev 1 or Sev 2 incident.
  • Differentiating in a crowded market. Online dispute portals are standard, including at American Express, so the roadmap competes on prevention and explainable AI rather than the portal itself.

Business Case (Base Scenario, Illustrative)

MeasureValue
One-time investment$612k
3-year NPV$149k (conservative ($839k), optimistic $1.34M)
3-year ROI26%
Payback after go-live2.3 years
Share of benefit from released ops capacity~85%
Merchant value at Year 3 (excluded from NPV)~$771k a year

Known Gaps & Next Steps

  • The Post-Launch Plan's iteration roadmap doesn't yet include the six beyond-MVP initiatives (RM-25 to RM-30) added to the Product Roadmap.
  • Concept screens S09–S13 are directional; each needs discovery, compliance review and a business case before it's real.
  • Next artifacts: API specification with a Postman collection, analytics tracking plan, and a BI dashboard mockup.

Conclusion

The simulation proves the full lifecycle end to end on one problem — discovery through SQL-level measurement — not just the parts that are easy to show. The honest caveat sits alongside the business case itself: the base-case NPV is positive ($149k), but the conservative case is negative (($839k)), and that range is driven by two named, unresolved assumptions (merchant adoption, whether released ops capacity is actually cashable) rather than hidden in a single rounded number. What's real: a traced requirement-to-KPI-to-incident chain and a reproducible SQL layer. What's still open: the three items above, each named rather than smoothed over.

Where each artifact is used

ArtifactUsed at
Competitor benchmarkDiscover — sets the baseline the PRD's requirements argue against
PRD + 47-item backlog + RTMDefine — turns the baseline into 24 traceable requirements and a sequenced MVP
13 wireframesDesign — makes the MVP vs. Phase-2 split (CR-01) concrete on screen
Roadmap + RAID log + change controlPlan & govern — carries the stale-deadline risk (R-03) through to the failing KPI (KPI-12)
3-scenario business case + launch/hypercare planJustify & launch — the base/conservative/optimistic range decision-makers actually need
17-slide executive reviewCommunicate — forces the five decisions the earlier stages set up
SQL labMeasure — the KPI definitions (win rate, CR-05) become queryable, including deliberately planted data problems
T2

Airline Operations Dashboard

Metrics & Analytics
6,000 flights analyzed Single fictional airline (Aravali Air) Self-contained HTML/JS dashboard Full dark-mode support Also built in Power BI: star schema + DAX

Tools used: Python (pandas), HTML/CSS/JS, Power BI (Power Query, DAX).

A Different Question Than the Delay Dashboard

The sibling Flight Delay Prediction Dashboard answers an OTA's question — which routes and airlines should get flagged as delay-risky — across five carriers. This one answers the question an airline's own ops team asks about itself: is my operation actually healthy, hub by hub and month by month, and what downstream cost does unreliability actually carry? One carrier, tracked in depth on on-time performance, load factor, revenue per flight, cancellation rate, complaints, and baggage handling, is the right shape for that question. This is also the SQL/Power BI discipline I used for PCMS reporting at Bajaj Finance, applied to a domain I hadn't worked in before — deliberately, as ETL/data-product practice.

My Approach

Same honest constraint as the sibling project: no real airline ops data is public or reachable from this environment, so this is a modeled dataset, disclosed as such on the dashboard itself. 6,000 simulated flights for one fictional carrier ("Aravali Air") across 5 real Indian hubs, with on-time performance, cancellation, load factor, revenue, complaints, and baggage mishandling each modeled with a documented, deliberate rule, not arbitrary noise: for example, complaints are weighted to rise sharply when a flight was delayed and further still when it was cancelled — a real, well-documented airline-ops pattern, and the whole reason this dataset exists rather than being five independent random columns. Full calculation, every parameter, and the reasoning behind each one are documented in the dashboard's own Methodology section, summarized here in full.

Show more: full calculation methodology, the data-quality fix I made (every number, and why)

Methodology: the calculation, step by step

For every one of the 6,000 simulated flights, in order:

  • On-time performance: starts from a base probability of 90%, reduced by that hub's congestion index (Delhi and Kolkata run busiest), then reduced further by −22pp if the hub is fog-sensitive and the month is Dec/Jan, or −14pp if monsoon-sensitive and the month is Jun–Sep.
  • Cancellation: decided separately as its own probability (base 0.6%, +hub congestion, +weather exposure). A cancelled flight is always counted as not on-time, never the reverse.
  • Load factor: drawn from a normal distribution around a base of 79%, shifted up in the Oct–Nov festive season and down in the Jan–Feb low season and at monsoon-exposed hubs during monsoon months.
  • Revenue: ticket revenue = passengers × a per-hub base fare × a seasonal fare multiplier; ancillary revenue (bags, seats, meals) added per passenger on top. Both zero for a cancelled flight.
  • Complaints: drawn from a weighted distribution that shifts hard toward more complaints when the flight was delayed, and harder still when it was cancelled — the one deliberate correlation this generator exists to demonstrate.
  • Baggage mishandling: one independent per-bag draw, rate rising with hub congestion and on any day operations went irregular (delayed or cancelled).

A data-quality decision worth naming: the dataset tracks two different passenger counts — passengers_expected (a demand estimate, computed the same way regardless of outcome) and passengers_boarded (zero for a cancelled flight, by definition). Load factor and revenue are correctly built on boarded passengers, since those only exist for flights that actually flew. My first pass used boarded passengers as the denominator for the complaints-rate metric too, which made cancelled flights show zero complaints per 1,000 passengers: the exact opposite of reality, purely because a cancelled flight boards nobody. I caught this by sanity-checking the output before building the chart, not after — the reliability-vs-complaints chart on the dashboard would otherwise have shown cancellations as the "safest" outcome for a customer, which is backwards. Complaints are rated against expected passengers instead: the people actually affected by the flight, whether it flew or not. This is the same kind of judgment call as excluding cancelled flights before averaging delay minutes in the sibling dashboard — a metric's denominator has to match what the metric is actually claiming to measure, and getting it wrong doesn't throw an error, it just silently produces a plausible-looking wrong number.

Why these specific numbers: not derived from any real source, chosen and then checked against public ballpark ranges for plausibility (domestic OTP typically 70–88%, load factor typically 75–85%, baggage mishandling typically 4–8 per 1,000 bags industry-wide). The fleet-wide numbers landed at 77.9% on-time, 78.9% load factor, and 5.4 bags mishandled per 1,000 — all inside those ranges. What this deliberately doesn't model: real distributional parameters fit from a published dataset (none was reachable from this environment), or knock-on delay (one late inbound aircraft delaying that same tail number's next departure) — a real ops model would need that, and it's a materially harder problem than this exercise scopes to.

Key Findings

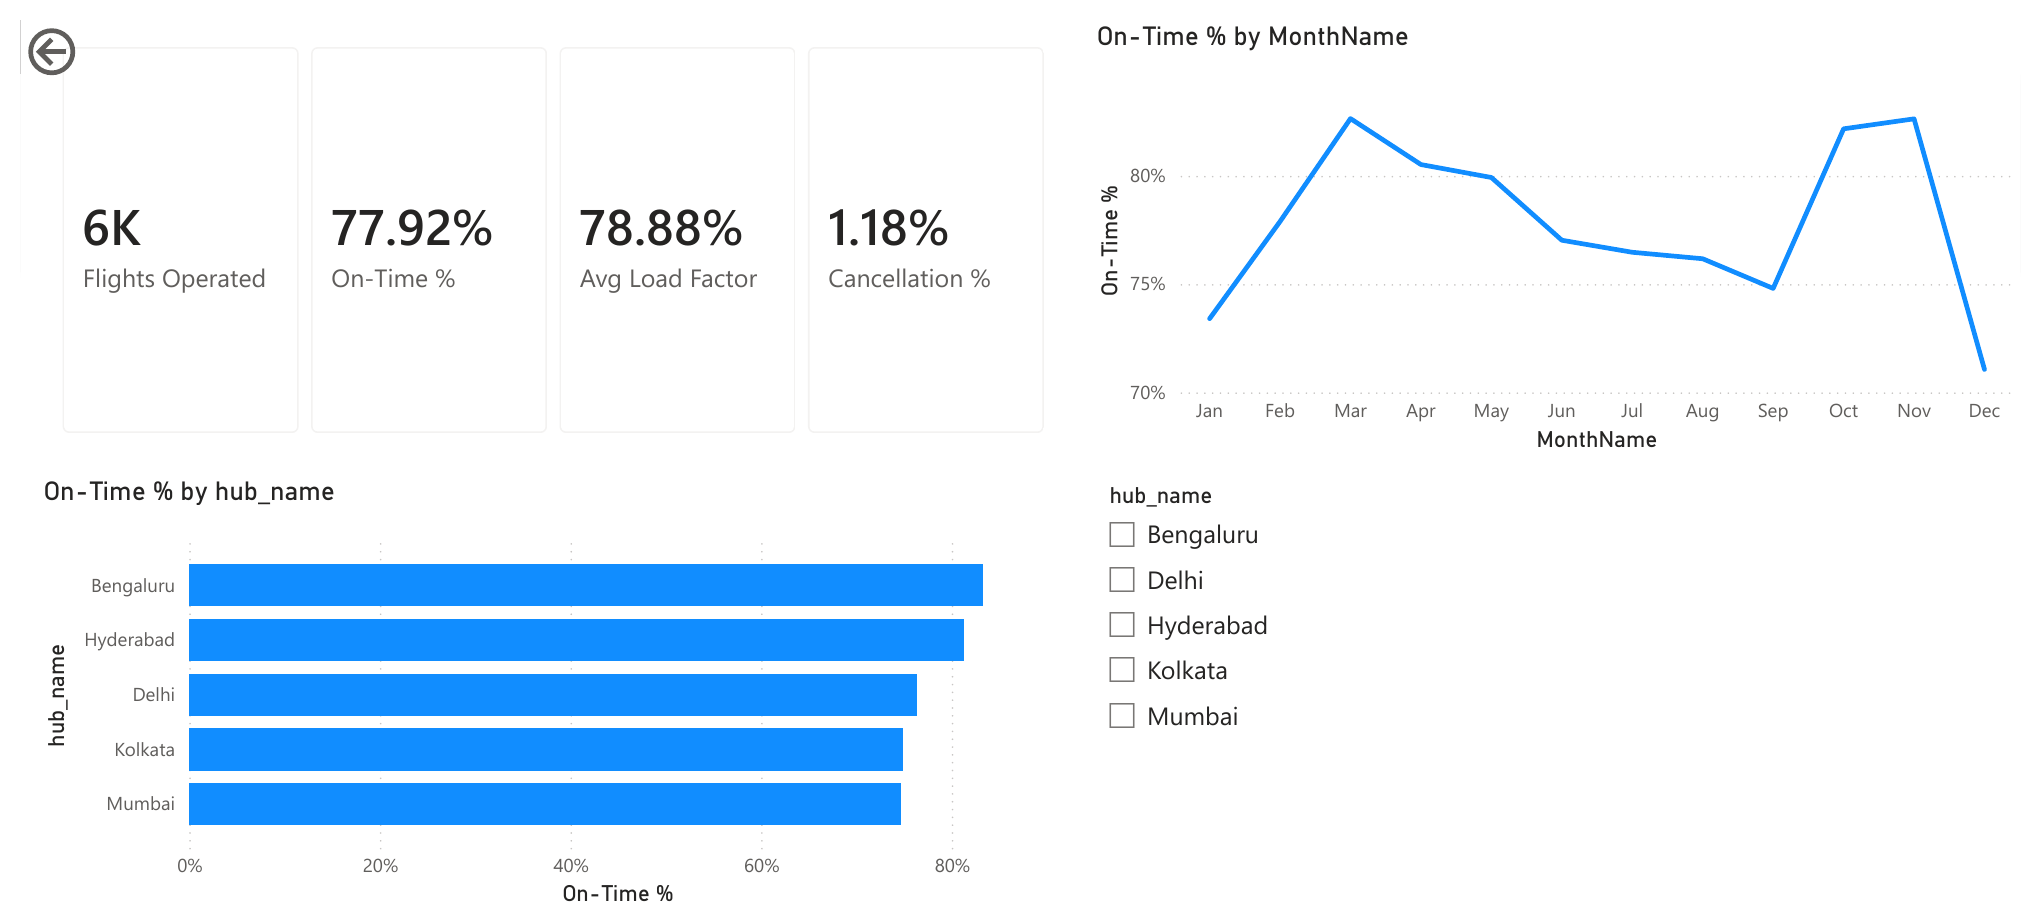
  • 77.9% on-time fleet-wide, 78.9% average load factor, 1.2% cancellation rate, ₹6,38,860 average revenue per flight.
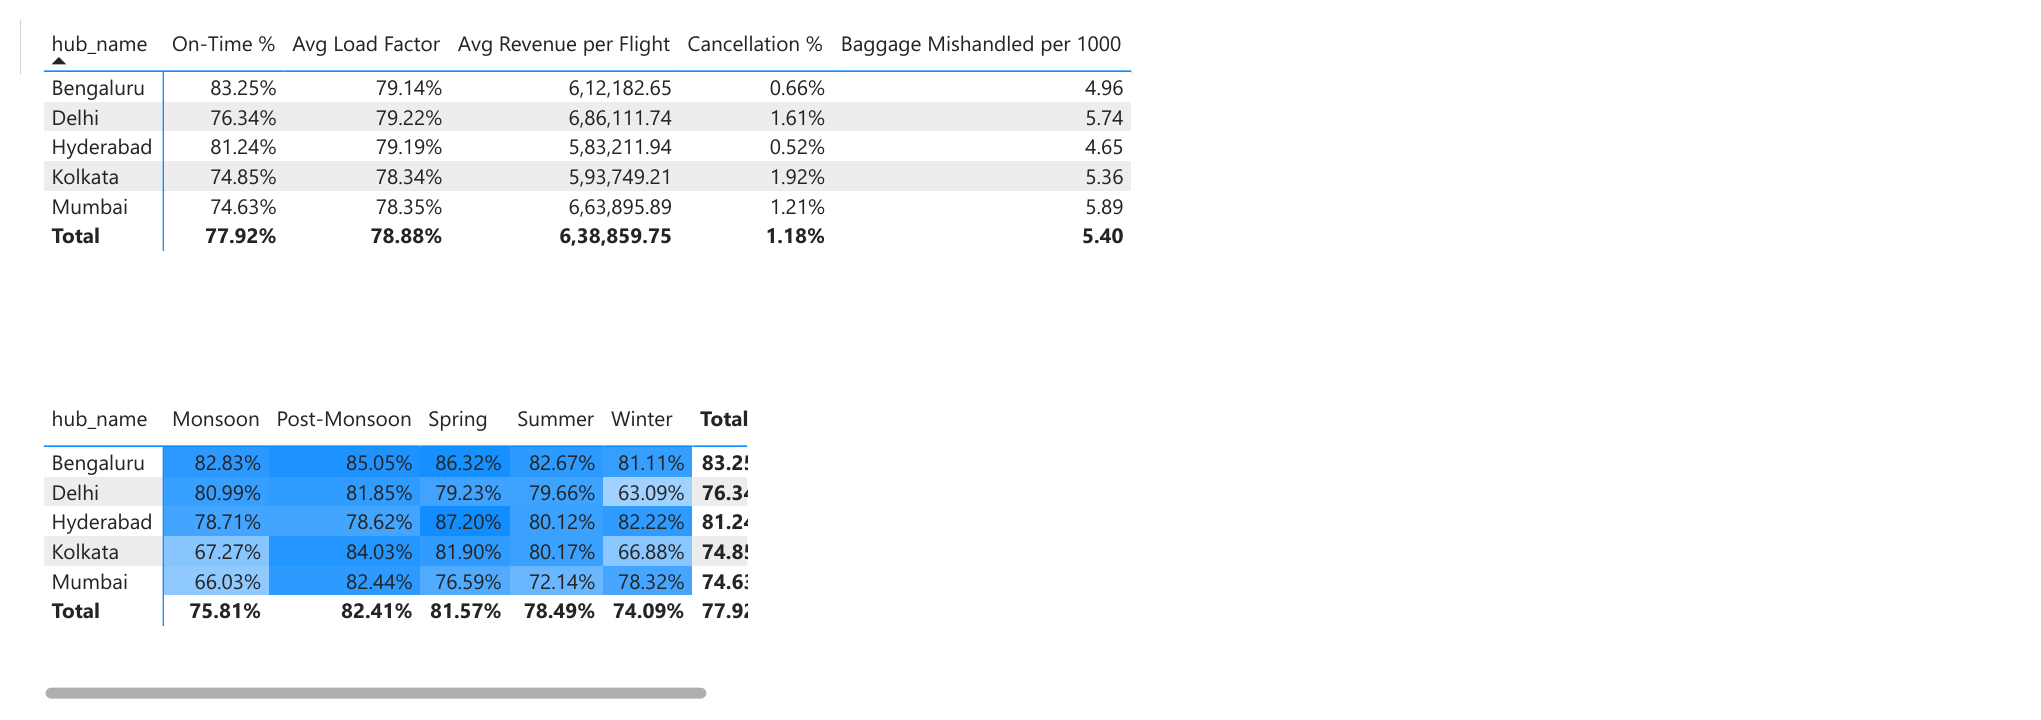
  • Bengaluru is the most reliable hub (83.3% on-time), Mumbai the least (74.6%): the two hubs with no modeled weather exposure sit at the top, the two with monsoon exposure sit at the bottom.
  • Delhi and Kolkata both collapse in Winter (63.1% and 66.9% on-time) from their own fog exposure; Mumbai and Kolkata separately collapse in Monsoon (66.0% and 67.3%) — Kolkata is the only hub that takes a hit twice a year instead of once, the same "double exposure" pattern that made DEL-GOI the worst route in the sibling delay dashboard.
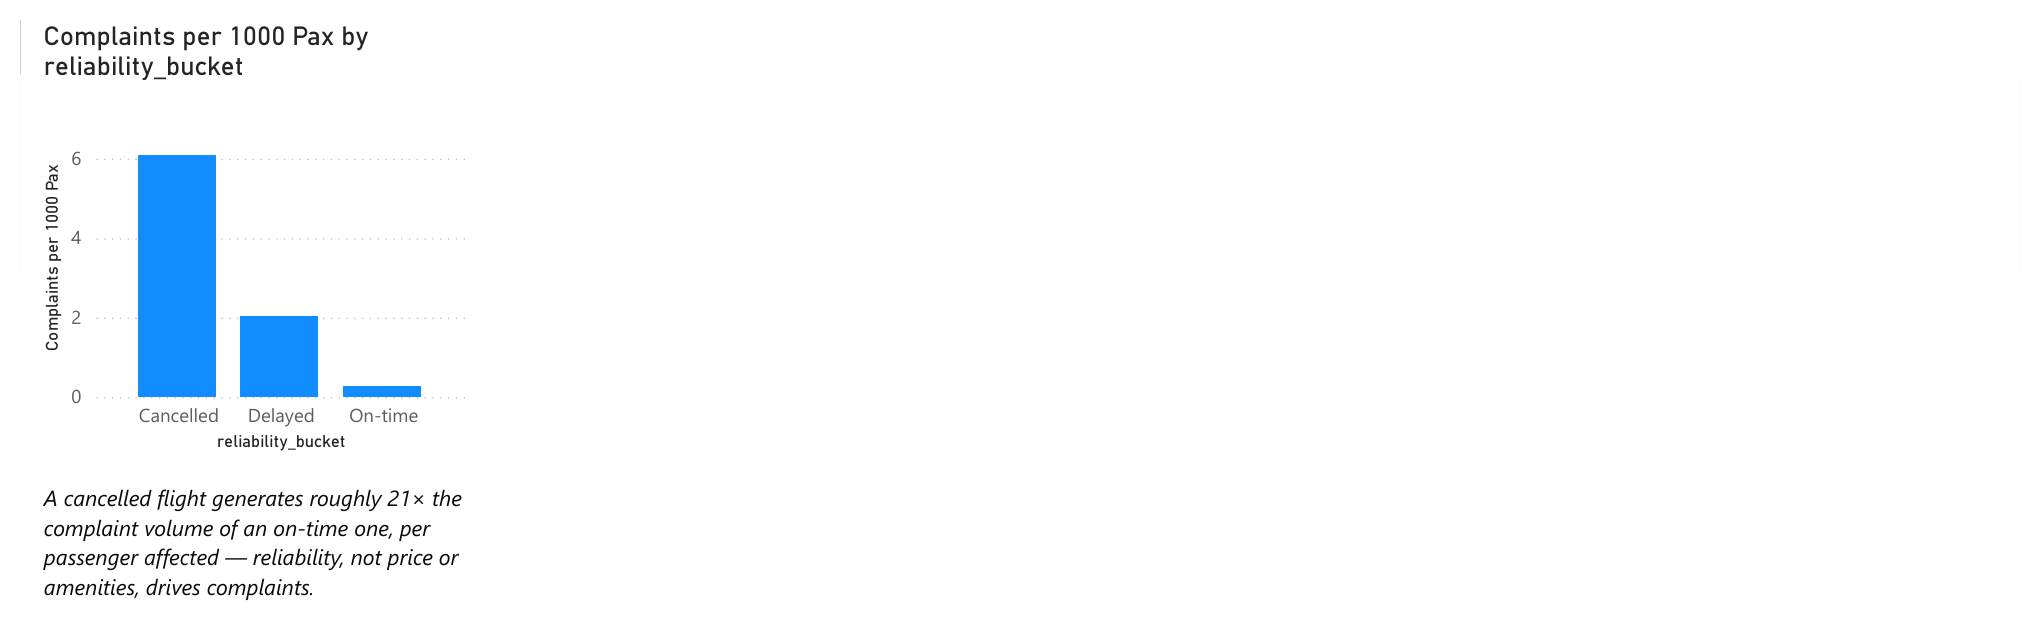
  • Complaints track reliability, not price or amenities: 0.29 complaints per 1,000 passengers when on-time, 2.05 when delayed, 6.10 when cancelled — a cancelled flight generates roughly 21× the complaint volume of an on-time one, per passenger affected.
  • Revenue doesn't track on-time performance: Delhi has the worst-adjacent on-time rate but the highest revenue per flight (₹6,86,112), because fare levels are set by hub demand, not by operational reliability. Reliability and revenue are two separate levers, not one.

Recommendations

What a PM would actually do with this, if it were live ops data instead of modeled data:

  • Fund reliability improvements by the complaint cost they prevent, not just the delay minutes they save. The 21× complaint multiplier on cancellations makes a stronger budget case than "average delay went down 2 minutes" ever will.
  • Give Kolkata a dedicated irregular-ops playbook, not a shared one. It's the only hub exposed to both major seasonal risks in this model; a generic playbook sized for single-exposure hubs will under-resource it twice a year.
  • Don't let a high-revenue hub's numbers hide its reliability problem. Delhi's revenue leadership could mask its on-time performance from a purely commercial dashboard — reliability and revenue need to stay on the same page, not two separate reports someone has to cross-reference manually.
  • Re-run this against real ops data before shipping anything downstream of it. This dashboard's job was to prove the ETL pipeline and the product judgment behind each transform decision, not to replace a real data source.

Where the Real Risk Sits

The same discipline as the sibling dashboard applies here: the risk isn't a wrong chart, it's a metric whose denominator quietly doesn't measure what its label claims — exactly what the passengers_expected/passengers_boarded fix above was catching. Say what's modeled, say what's real, and check a metric's denominator before trusting what it shows, not after.

Also Built as a Power BI Report

The same analysis, built a third way: a Power BI report using Power Query (M) for the transform step and DAX for every measure, instead of pandas. A star schema with one fact table (Fact_Flights) and two dimension tables (Dim_Hub, and a Dim_Date table built with a DAX CALENDAR() function rather than imported) — the tool-native way an ETL/BI Product Owner's team would actually structure this, distinct from and complementary to the Python version above, not a replacement for it.

Built specifically for practice, not because the Python version needed a second build. Worth naming: the DAX measures landed on numbers matching the Python version almost exactly — 83.25% on-time for Bengaluru in Power BI vs. 83.3% in Python, 76.34% vs. 76.3% for Delhi — two completely independent computations agreeing. The Complaints per 1000 Pax DAX measure also carries forward the same passengers_expected denominator fix from the Python build, rather than re-discovering the same bug a second time.

Quick recall

SectionSummary
ProblemAn airline's own ops team needs to know if its operation is actually healthy — hub by hub, season by season — and what unreliability costs downstream in complaints, not just in delay minutes. No real airline ops data was reachable from this environment, so the gap had to be closed with a disclosed, rule-based model instead of pretending to real data.
Research stepsModeled 6,000 flights for one carrier across 5 real hubs, each metric built on a documented rule (congestion, fog/monsoon exposure, seasonal fare multipliers) → sanity-checked the output before charting it, which is what caught the passengers_expected/passengers_boarded bug → checked the fleet-wide numbers against public plausibility ranges → rebuilt the same analysis a second, independent way in Power BI to cross-check the first.
SolutionA self-contained HTML/JS dashboard (dark-mode supported) plus a Power BI star-schema report, both surfacing on-time %, load factor, revenue, cancellations, complaints and baggage handling together on one page instead of across separate commercial/ops reports.
ConclusionThe two independent builds landed on matching numbers (83.25% vs. 83.3% Bengaluru on-time), which is the real proof point — not the specific numbers themselves, since the data is modeled. The job this dashboard actually proves is the ETL pipeline and the judgment behind each transform decision; it explicitly should not be trusted as real ops data, and says so on the dashboard itself.

Where each build is used

BuildUsed for
Python/pandas pipelineGenerates and transforms the 6,000-flight dataset, catches the denominator bug before any chart is built on top of it
HTML/JS dashboardThe shareable, interactive artifact — KPI tiles, hub ranking, the methodology write-up, light/dark mode
Power BI (Power Query + DAX)A second, tool-native rebuild for cross-validation and to demonstrate the star-schema/DAX skill set separately from the Python one
Power BI Overview page: KPI cards for flights operated, on-time %, load factor, and cancellation %, a bar chart of on-time % by hub, a chronological month trend line, and a hub slicer Power BI Hub Deep-Dive page: a table of all 5 measures by hub, and a hub-by-season matrix with conditional-formatting heatmap on on-time %, Delhi Winter darkest at 63.09% Power BI Reliability and Complaints page: a column chart of complaints per 1,000 passengers by reliability bucket, cancelled flights roughly 21x the on-time rate

Power BI report screenshots — Overview, Hub Deep-Dive, and Reliability & Complaints pages. Download the .pbix file → Build guide and source data: projects/airline-operations-dashboard/power-bi/ in the repo.

Airline Operations Dashboard: KPI tiles (6,000 flights, 77.9% on-time, 78.9% load factor) and a bar chart ranking all 5 hubs by on-time performance, Bengaluru best at 83.3%, Mumbai worst at 74.6%

Click the screenshot to open the live, interactive dashboard (also available in dark mode).

T33

Amplitude Analytics — Strideway (Advanced)

Metrics & Analytics
Full 6-step monetization funnel Retention curve segmented by channel Real conversion-window bug found and fixed Hit a real Starter-plan limit on cohorts

Tools used: Amplitude (Funnel analysis, Retention analysis, Cohorts), the Amplitude Chart API (used to diagnose the bug below).

Why Advanced, Not Just Basic

Segmentation charts prove I can read a single metric; this half proves I can trace a user journey end to end — funnel conversion, retention over time, and cohort definition, the exact Amplitude patterns behind most growth/monetization dashboards. Same Strideway dataset as the Basic case study (T32).

A Real Amplitude Bug, Found and Fixed

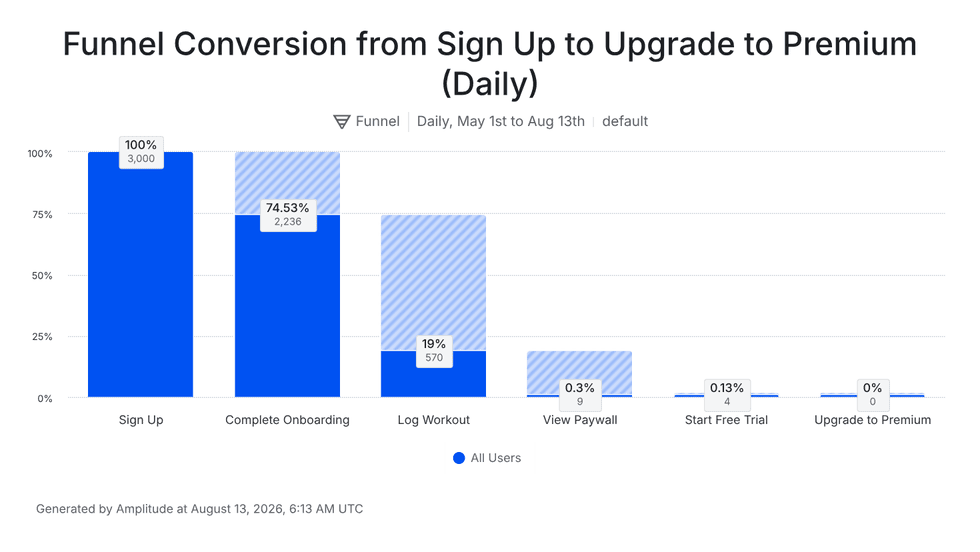
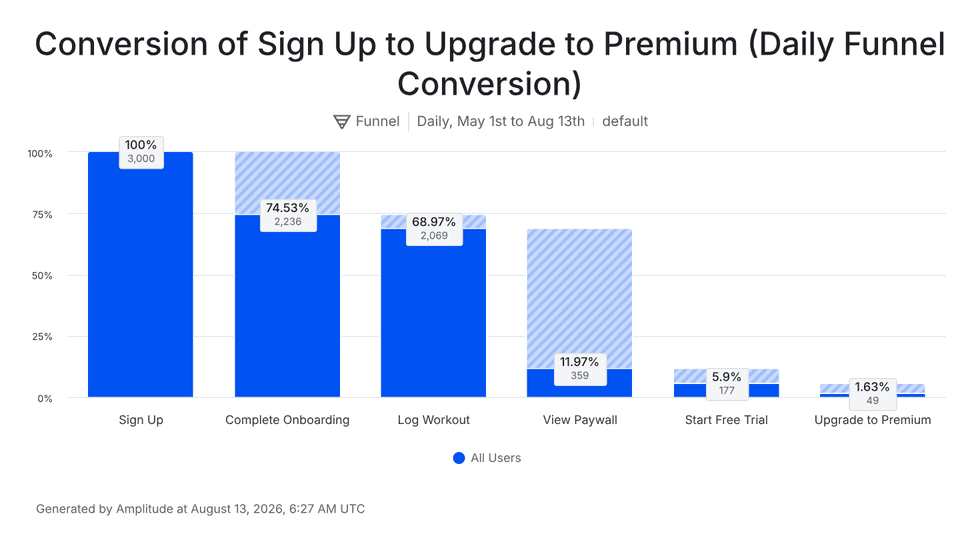
The first funnel I built — Sign Up → Complete Onboarding → Log Workout → View Paywall → Start Free Trial → Upgrade to Premium — came back showing only 19% conversion from onboarding to a first logged workout. That looked wrong: nearly every onboarded user in this dataset eventually logs a workout. I checked directly against the raw dataset and confirmed it — 92.5% of onboarded users eventually log at least one workout, nowhere near 19%.

The cause, found by pulling the chart's real definition through Amplitude's own API rather than guessing: Amplitude funnels default to a 1-day conversion window between each step (conversionSeconds: 86400). Since many users in this dataset don't log their first workout until well after onboarding — they open the app sporadically over weeks, not daily — a 1-day window was silently dropping every conversion that happened even slightly later than that, while still reporting a clean-looking, plausible percentage. Widening the window to 90 days fixed it exactly: Log Workout jumped to 68.97% (2,069 of 2,236), matching the raw dataset precisely.

Key Findings

  • Full funnel, corrected: Sign Up 3,000 → Complete Onboarding 74.53% → Log Workout 68.97% → View Paywall 11.97% → Start Free Trial 5.9% → Upgrade to Premium 1.63% (49 users) — a realistic, multi-week monetization path, not a same-day one.
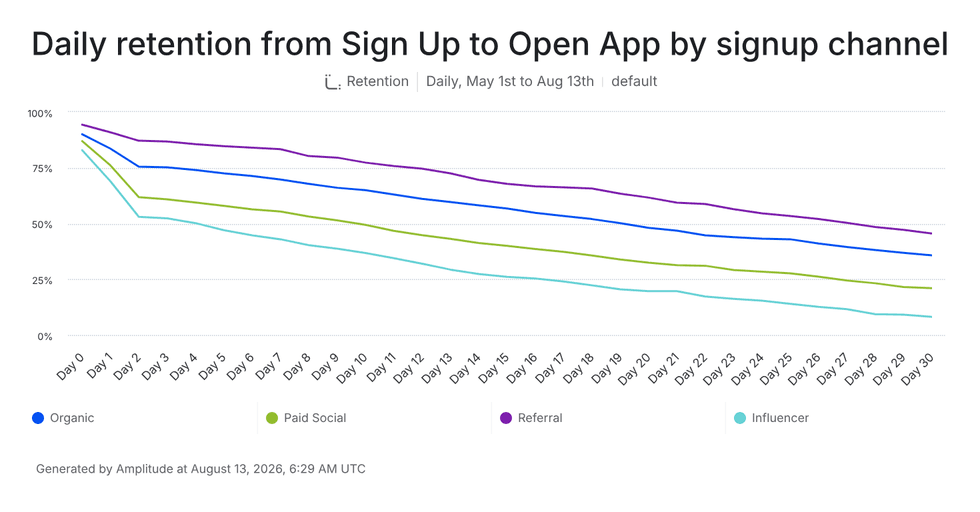
  • Retention by channel is the clearest chart in the whole project: at Day 30, Referral-acquired users retain around 46%, Organic around 36%, Paid Social around 22%, and Influencer around 9% — a roughly 5x spread between the best and worst channel, purely from acquisition source.
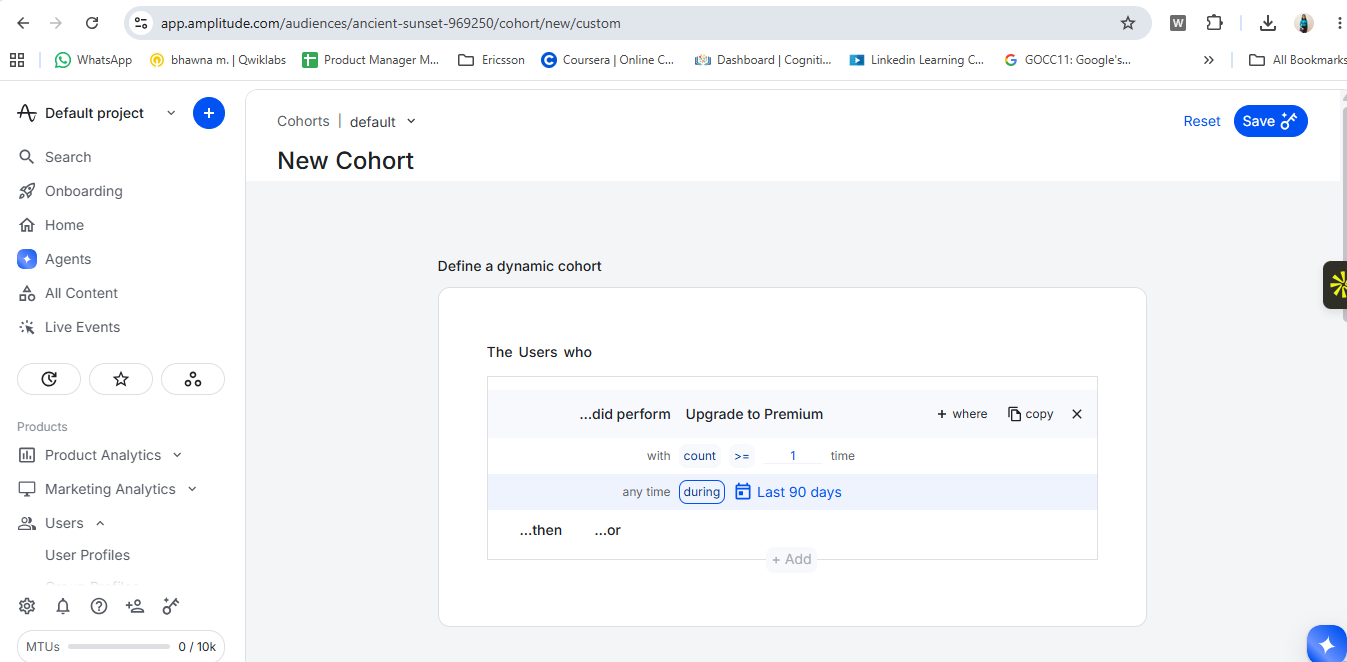
  • Cohort creation hit a real plan limit: dynamic (auto-recalculating) cohorts require a paid Amplitude plan; the Starter tier blocked saving one. The definition itself — "users who performed Upgrade to Premium, count ≥ 1" — was correct; only persisting it as a live cohort was gated. A genuine, worth-knowing constraint of the free tier, not a mistake.

What This Means, Applied

The retention chart changes the decision quite a bit: I wouldn't automatically scale Influencer just because it brings users in. I'd treat Referral as the stronger quality channel if its retained-user curve is consistently better. As PM, I'd shift more acquisition effort toward Referral, while keeping Influencer as a controlled acquisition experiment. For Influencer, I'd dig into which creators, audiences, and landing experiences are producing retained users rather than judging the channel only on acquisition volume. I'd also set up a cohort comparison for Influencer vs. Referral — same signup period, same retention window, ideally normalized by plan — to make sure the difference isn't caused by audience mix. The goal wouldn't be "kill Influencer"; it would be optimize for retained customers, not just acquired customers. If Referral continues to show stronger retention, I'd increase investment there and use Influencer selectively where creators can demonstrate comparable downstream retention.

Before / After: the funnel-window fix

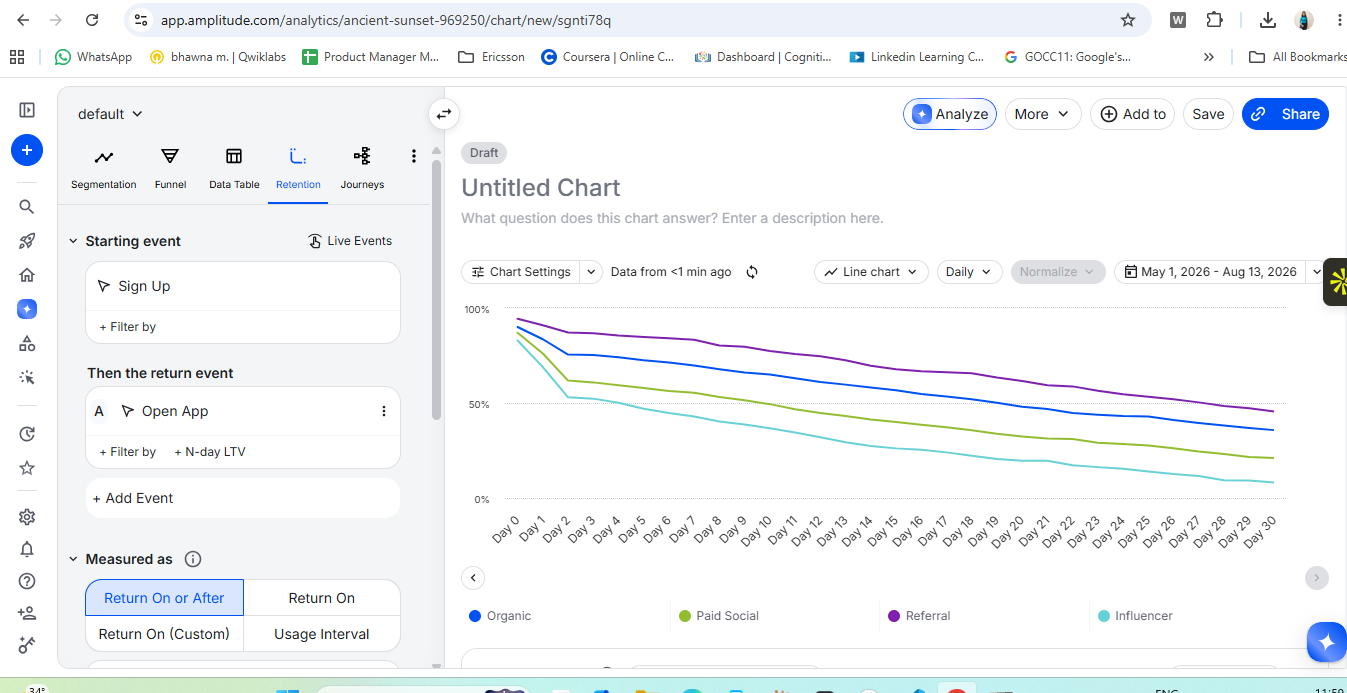
Amplitude funnel chart before the fix: Sign Up 100%, Complete Onboarding 74.53%, Log Workout only 19% (570 users), View Paywall 0.3%, Start Free Trial 0.13%, Upgrade to Premium 0% — the 1-day conversion window silently dropping real conversions Amplitude funnel chart after widening the conversion window to 90 days: Sign Up 100%, Complete Onboarding 74.53%, Log Workout 68.97% (2,069 users), View Paywall 11.97%, Start Free Trial 5.9%, Upgrade to Premium 1.63% — matching the raw dataset exactly Amplitude retention chart: Daily retention from Sign Up to Open App by signup channel over 30 days — Referral (purple) highest around 46% by Day 30, Organic (blue) around 36%, Paid Social (green) around 22%, Influencer (teal) lowest around 9% Amplitude retention chart builder, full browser view: Starting event Sign Up, return event Open App, Measured as 'Return On or After' — the actual configuration panel behind the retention-by-channel chart, not just its output Amplitude New Cohort screen: users who performed Upgrade to Premium, count >= 1 time, during Last 90 days — a correct definition that could not be saved on the free Starter plan (dynamic cohorts are a paid feature)

All 5 screenshots are real captures from my own live Amplitude project — including the broken funnel and the retention chart's builder panel, left in on purpose to show the actual process rather than only clean, cropped results.

Quick recall

SectionSummary
ProblemThe Basic case study proves I can read a single metric; it doesn't prove I can trace a full user journey — funnel conversion, retention over time, cohort definition — the Amplitude patterns behind most real growth/monetization dashboards.
Research stepsBuilt the 6-step funnel → the first result (19% onboarding→workout conversion) looked implausible against the raw dataset (92.5% actually convert) → pulled the chart's real definition through Amplitude's own Chart API instead of guessing → found the default 1-day conversion window was silently dropping late conversions → widened it to 90 days and confirmed the fix matched the raw data exactly (68.97%) → built the retention-by-channel chart and attempted to save a cohort, which hit a real Starter-plan limit.
SolutionThe corrected funnel, a retention-by-channel chart, and a verified cohort definition — plus the "What This Means, Applied" recommendation above: shift acquisition investment toward Referral, use Influencer as a controlled experiment, and normalize any channel comparison by plan before trusting it.
ConclusionThe real finding isn't the funnel percentages themselves — it's that a tool's default setting (a 1-day conversion window) can silently produce a clean, plausible, and completely wrong number, and the only way to catch that is checking a surprising result against the raw data instead of trusting the chart.
T38

NSDL KYC Verification — API Testing Practice

Metrics & Analytics
Real Node.js mock server with actual validation logic, not canned responses 9 real test scenarios: connectivity → auth → request validation → business logic → server error 3 real mistakes made and caught mid-build, documented rather than edited out Also used to drill raw HTTP method fundamentals (GET/POST/PUT/PATCH/DELETE) against a live public API

Tools used: Postman (collection, Authorization tab, Tests scripts, a code-based local mock server), Node.js.

Why This Project

A follow-on to the Partner Ops project, built to answer a more specific question: how would I actually verify a third-party KYC check — the exact kind of NSDL/Aadhaar verification a lending onboarding flow depends on — beyond "I sent a request and got a response back." Self-directed practice, not a real NSDL integration or client work.

Step by Step — From Collection to Result

Step 1 — Build the request

A new Postman collection, one request: POST {{baseUrl}}/v1/kyc/verify, with an Authorization: Bearer header and a JSON body.

{ "customerId": "TEST001", "pan": "ABCDE1234F", "dob": "1995-06-15" }

Step 2 — Define the 9 examples first (the expected contract)

Before testing anything, 9 examples got built — one per scenario, each a request/response pair stating what should happen. This is the answer key: without it, there's nothing to check a real response against.

1. Valid

Token: VALID_TEST_TOKEN Body: { "customerId": "TEST001", "pan": "ABCDE1234F", "dob": "1995-06-15" }
Expected — 200 OK { "status": "SUCCESS", "customerId": "TEST001", "kycStatus": "VERIFIED", "verificationDate": "2026-09-10", "requestId": "REQ-10001" }

2. Missing PAN

Token: VALID_TEST_TOKEN Body: { "customerId": "TEST001", "dob": "1995-06-15" }
Expected — 400 Bad Request { "status": "FAILED", "errorCode": "MISSING_FIELD", "message": "PAN is required" }

3. Invalid PAN format

Token: VALID_TEST_TOKEN Body: { "customerId": "TEST001", "pan": "12345", "dob": "1995-06-15" }
Expected — 400 Bad Request { "status": "FAILED", "errorCode": "INVALID_FORMAT", "message": "PAN format is invalid (expected AAAAA9999A)" }

4. Invalid token

Token: WRONG_TOKEN Body: { "customerId": "TEST001", "pan": "ABCDE1234F", "dob": "1995-06-15" }
Expected — 401 Unauthorized { "status": "FAILED", "errorCode": "INVALID_TOKEN", "message": "Invalid or expired token" }

5. Missing auth

Token: (none — Auth Type set to "No Auth") Body: { "customerId": "TEST001", "pan": "ABCDE1234F", "dob": "1995-06-15" }
Expected — 401 Unauthorized { "status": "FAILED", "errorCode": "MISSING_AUTH", "message": "Authorization header is required" }

6. Customer not found

Token: VALID_TEST_TOKEN Body: { "customerId": "NOTFOUND001", "pan": "ABCDE1234F", "dob": "1995-06-15" }
Expected — 404 Not Found { "status": "FAILED", "errorCode": "CUSTOMER_NOT_FOUND", "message": "No customer found with this ID" }

7. Invalid DOB format

Token: VALID_TEST_TOKEN Body: { "customerId": "TEST001", "pan": "ABCDE1234F", "dob": "15-06-1995" }
Expected — 400 Bad Request { "status": "FAILED", "errorCode": "INVALID_DATE_FORMAT", "message": "dob must be in YYYY-MM-DD format" }

8. Duplicate request

Token: VALID_TEST_TOKEN Body: { "customerId": "DUPLICATE001", "pan": "ABCDE1234F", "dob": "1995-06-15" }
Expected — 409 Conflict { "status": "FAILED", "errorCode": "DUPLICATE_REQUEST", "message": "A KYC request for this customer is already in progress" }

9. Server error

Token: VALID_TEST_TOKEN Body: { "customerId": "ERROR001", "pan": "ABCDE1234F", "dob": "1995-06-15" }
Expected — 500 Internal Server Error { "status": "FAILED", "errorCode": "INTERNAL_ERROR", "message": "Something went wrong on our end" }

One real mix-up along the way, worth keeping: an example has two separate halves — request (what gets sent) and response (what comes back) — and the first attempt typed the expected response into the request half by mistake, leaving the actual response empty. Easy error, and it's exactly why having the expected answer written down first matters: it made the mistake obvious immediately, instead of only surfacing later when a real test didn't behave as expected.

Postman turned out to offer two separate mock types — this example-matching one, and a newer code-based "Mock (BETA)" that runs real logic. The code-based one is what Step 5's actual test run used, but these 9 examples are what "correct" was defined against.

Step 3 — Stand up a mock server with real logic, not a canned answer

Rather than a static example response, the mock server runs actual validation code: checks the auth header, checks each required field is present, validates PAN against the real NSDL format pattern (AAAAA9999A) and the date against YYYY-MM-DD, then branches into business-rule outcomes (not found, duplicate in progress, server error, a deliberately slow response for a timeout test) keyed off specific test customer IDs. It genuinely evaluates whatever gets sent to it, the same as a real backend would.

Step 4 — Two more real mistakes in the code-based mock, caught by checking the actual response, not just the status

First: a JSON body got pasted into the URL field by accident — Postman returned "Invalid character in header content", which is a real, specific error a mixed-up field produces. Second, and more instructive: a request came back 401 Unauthorized when it should have been 200 — not because the mock was broken, but because the Authorization tab's Token field was empty (a token typed into the wrong field earlier). The fix in both cases was reading what the response actually said instead of assuming the request was fine.

POST {{baseUrl}}/v1/kyc/verify Authorization: Bearer VALID_TEST_TOKEN Body: { "customerId": "TEST001", "pan": "ABCDE1234F", "dob": "1995-06-15" }

Output — 200 OK

{ "status": "SUCCESS", "customerId": "TEST001", "kycStatus": "VERIFIED", "verificationDate": "2026-09-10", "requestId": "REQ-10001" }

Step 5 — Run it again with different data, to prove it's not hardcoded

If the mock just matched Step 2's exact inputs, that would prove nothing — it could be a lookup table. So this run deliberately sends different values — different customer ID, a different (but still valid) PAN, a different DOB, a different wrong token — same 9 scenario types, none of the literal data reused. The 3 business-rule cases (not found / duplicate / server error) keep the same trigger ID, because those are literal constants the mock's code checks for by design — the same convention real sandbox environments use (e.g. a payment gateway's test card numbers that deliberately trigger a decline). Everything else genuinely varies.

Where this gets typed: the same KYC Verify request's Authorization and Body tabs in Postman — not a new request — sent against the code-based mock server running locally at http://localhost:4501.

1. Valid request

Token: VALID_TEST_TOKEN Body: { "customerId": "TEST002", "pan": "XYZAB5678C", "dob": "1998-11-23" }
Actual — 200 OK ✅ (matches expected) { "status": "SUCCESS", "customerId": "TEST002", "kycStatus": "VERIFIED", "verificationDate": "2026-09-10", "requestId": "REQ-10001" }

2. Missing PAN

Token: VALID_TEST_TOKEN Body: { "customerId": "TEST002", "dob": "1998-11-23" }
Actual — 400 Bad Request ✅ (matches expected) { "status": "FAILED", "errorCode": "MISSING_FIELD", "message": "PAN is required" }

3. Invalid PAN format

Token: VALID_TEST_TOKEN Body: { "customerId": "TEST002", "pan": "999999", "dob": "1998-11-23" }
Actual — 400 Bad Request ✅ (matches expected) { "status": "FAILED", "errorCode": "INVALID_FORMAT", "message": "PAN format is invalid (expected AAAAA9999A)" }

4. Invalid token

Token: FAKE_TOKEN_999 Body: { "customerId": "TEST002", "pan": "XYZAB5678C", "dob": "1998-11-23" }
Actual — 401 Unauthorized ✅ (matches expected) { "status": "FAILED", "errorCode": "INVALID_TOKEN", "message": "Invalid or expired token" }

5. Missing auth

Token: (none — Auth Type set to "No Auth") Body: { "customerId": "TEST002", "pan": "XYZAB5678C", "dob": "1998-11-23" }
Actual — 401 Unauthorized ✅ (matches expected) { "status": "FAILED", "errorCode": "MISSING_AUTH", "message": "Authorization header is required" }

6. Customer not found

Token: VALID_TEST_TOKEN Body: { "customerId": "NOTFOUND001", "pan": "XYZAB5678C", "dob": "1998-11-23" }
Actual — 404 Not Found ✅ (matches expected) { "status": "FAILED", "errorCode": "CUSTOMER_NOT_FOUND", "message": "No customer found with this ID" }

7. Invalid DOB format

Token: VALID_TEST_TOKEN Body: { "customerId": "TEST002", "pan": "XYZAB5678C", "dob": "23-11-1998" }
Actual — 400 Bad Request ✅ (matches expected) { "status": "FAILED", "errorCode": "INVALID_DATE_FORMAT", "message": "dob must be in YYYY-MM-DD format" }

8. Duplicate request

Token: VALID_TEST_TOKEN Body: { "customerId": "DUPLICATE001", "pan": "XYZAB5678C", "dob": "1998-11-23" }
Actual — 409 Conflict ✅ (matches expected) { "status": "FAILED", "errorCode": "DUPLICATE_REQUEST", "message": "A KYC request for this customer is already in progress" }

9. Server error

Token: VALID_TEST_TOKEN Body: { "customerId": "ERROR001", "pan": "XYZAB5678C", "dob": "1998-11-23" }
Actual — 500 Internal Server Error ✅ (matches expected) { "status": "FAILED", "errorCode": "INTERNAL_ERROR", "message": "Something went wrong on our end" }

Result — 9 for 9, with entirely different data than Step 2 used. Same category of input still lands on the same correct branch every time — real validation logic, not a lookup table keyed to one specific example.

A Self-Caught Mistake Worth Keeping In

Alongside this, the same session included a plain HTTP-methods drill against a public test API (GET/POST/PUT/PATCH/DELETE, no mock involved) — and one request meant to be a PATCH was accidentally sent as a leftover GET. It still came back 200 OK. The status code alone said nothing was wrong; only checking the response body — the "update" had silently not happened — caught it. That's the actual habit this whole project was practicing: a green status code is not proof the intended thing occurred, the response content is.

Quick recall

SectionSummary
ProblemA follow-on to the Partner Ops project: how would I actually verify a third-party KYC check — the exact kind of NSDL/Aadhaar verification a lending onboarding flow depends on — beyond "I sent a request and got a response back."
Research stepsBuilt the request contract → defined all 9 expected scenarios first as the answer key, before testing anything → stood up a code-based mock server that runs real validation logic instead of canned answers → caught 2 real mistakes by reading the actual response body, not just the status code → re-ran all 9 scenarios with entirely different data to prove the logic wasn't a lookup table → separately caught a silent no-op bug (a PATCH sent as a leftover GET, still returning 200 OK) in a plain HTTP-methods drill.
SolutionA real Node.js mock server covering 9 scenarios — valid, 5 validation/auth failure modes, not-found, duplicate, and server error — plus a documented example-contract defining what "correct" means before any test is run against it.
Conclusion9 for 9 on a second run with completely different data — real validation logic, not a hardcoded match. The actual habit this project was practicing: a green status code is never proof the intended thing happened; only the response content is.
T43

Travel Problem Radar — Travel Problems Turned Into Product Ideas

Searches the web for travel problems, sorts them into 4 categories, flags what is new, and attaches a product opportunity to each Public demo replays a saved 8-item sample: no AI calls, no key, no cost Live page is read-only: a server job sweeps every 5 hours, and visitors never trigger an AI call 68 server tests and 19 repo checks, all offline, run on every push Not yet measured: whether what the AI finds is accurate. No real sweep has been scored

Tools used: React (one component, three ways to run), Claude with its web-search tool, Vercel Functions, Cron and Blob storage, GitHub Actions (the 5-hour schedule), GitHub Pages, esbuild. Optional Slack and email (Resend) delivery of each digest. Product owner; built with AI (Claude).

Why This Project

The best product ideas in travel start as someone's bad day: a refund that never came, a visa fee that quietly quadrupled, a booking that vanished after payment. Those signals are scattered across news, government notices, outage trackers and review sites, and no PM has time to read all of it every day. The radar is a standing feed that finds the problems, sorts them and suggests the "so what" before the morning starts.

Key Decisions and Tradeoffs

  • Four category calls instead of one big prompt. Gave up a single ranked list. Got parallel calls, and one failed category no longer sinks the other three.
  • Visitors never trigger an AI call. The live page reads a sweep saved by a server job, so cost does not grow with traffic and the API key stays on the server.
  • The public demo replays a saved sample. Anyone can open it with no key and nothing that can break; the trade-off is that the sample is from July 2026.
  • "New" means the headline has not been seen before. A simple rule that can be tested; the same event under a new headline will show as New again.

What Went Wrong, and What Is Still Unproven

The first production sweep saved items from only 1 of 4 categories. The cause was an output token limit (the model's thinking counts toward it). It is fixed, and a local run returned all four categories. I have not yet confirmed it with a scheduled production run. The bigger open risk is that no real sweep has been scored for accuracy, so the page tells readers to check each source link. A draft scoring rubric is in the repo; it has not been run.

Quick recall

SectionSummary
ProblemTravel problems are scattered across news, government notices, outage trackers and review sites, so a PM finds the ones worth solving late or not at all
SolutionA sweep of four categories with web search, a product opportunity on every item, a demo that replays a sample, and a live page refreshed by a server job
ResultWorking demo and live page; 68 server tests and 19 repo checks pass offline; a token-limit failure found in the first production sweep and fixed
Not yet measuredAccuracy of the AI's findings, and whether anyone besides me finds the opportunities useful
Show more case studies Flight Booking Teardown, Travel Support AI Copilot, T5 (delay dashboard), T8, SQL/Amplitude Basics, Weft, Career Copilot, and cross-industry practice work →
05

Research

// live, ongoing — updated as it develops, not a one-time writeup

Not every case study starts as a build. This one started as a question — "what problem is a company like Deloitte actually working on, that a PM could credibly help with?" — and turned into a documented, source-verified pattern about what breaks when companies plug generative AI into real client-facing work. I'm keeping it live and adding to it as the research goes deeper, and using it as the basis for a practice exercise below on what actually running the fix would look like.

🔍
The Verification Gap
🔬 Ongoing research · started 14 Aug 2026, updated as it develops
24 problem statements mapped by who actually owns each one 12+ organizations traced worldwide, across 6 sectors India-specific: Supreme Court zero-tolerance ruling, July 2026 Primary sources only — court filings and official regulator PDFs

🎯 Problem

A vendor's AI platform is built to solve a broad problem well, for millions of possible customers. It was never built to know whether it got a specific client's specific facts right in a specific deliverable. That depth is structurally the buyer's job, not the vendor's — no procurement checklist, certification, or contract clause changes that. Deloitte's Azure OpenAI setup passes nearly every item on a standard AI-vendor due-diligence checklist; that was never where the failure was. The real problem is a missing internal verification layer — the same gap sitting under two AI-fabricated Deloitte reports six weeks apart, an EY report pulled for 16 fabricated sources, a KPMG report with 40 of 45 citations wrong, and 1,313 documented US court cases involving AI-fabricated content.

🔬 Research — what I actually did, in order

StepWhat I didFound
1. LandscapeMapped 24 problem statements and traced 12+ real incidents (Deloitte ×2, EY, KPMG, PwC…) across 6 sectors, sourced only to primary documents — court filings, regulator PDFsThe failure pattern sits in a missing internal verification layer, not vendor AI quality
2. Hands-on auditSourced a real, unflagged, public Deloitte report and ran the citation check myself instead of relying on others' findings100 in-text citations, only 49 have a matching bibliography entry — 51 traced claim-by-claim, page by page
3. FrameworkBuilt an 8-step verification method → expanded to 16 failure modes across 5 tiers (structural / semantic / provenance / temporal / governance) → corrected scope from "hallucination" to a precise splitHonest result: 49 Verified · 0 Hallucinated · 51 Unverifiable — not the inflated "51 hallucinations" headline it would've been easy to claim
4. Market scan + architectureChecked what already exists (SwanRef, Patronus, Vectara, GPTZero, Workiva…) against the 16 failure modes, then designed a 12-stage, 3-track pipeline from the gapNo existing tool stitches structural + semantic + provenance + governance together, aimed at a firm's own published research
5. Data handling, design, prototypeAnswered "where does the confidential data go" before building anything client-facing; confirmed Patronus Lynx / Vectara are self-hostable; built wireframes → static design → a clickable prototype, in that orderOnly 4 narrow touchpoints ever need to leave the firm's own network — everything else stays in-house
6. Landing page + self-auditBuilt a real sign-up front page, then ran a completeness pass on my own build — navigation, buttons, error states4 of 7 planned screens are still wireframe-only, no error states exist yet — flagged plainly instead of overclaiming "launch-ready"

💡 Proposed solution

The Verification Gap Engine — a platform that forks every citation into three tracks right after it's extracted: Track A (has a source — tested by up to 12 specialist checks and can only ever come back Real, Fabricated, or Suspicious), Track B (no source at all — stays Unverifiable, and is never allowed to claim fabrication), and Track C (a bare, uncited claim in the body text — flagged as Unsupported, not confused with either of the other two). All three converge into one scorecard, a human review queue for anything uncertain, and a governance layer that decides publish/hold/review against a firm's own configured threshold — with the one specialist that actually reads draft text running on a self-hosted model, never a public API.

✅ Conclusion

The gap is real, not assumed — confirmed by actually running the check on a real report and by benchmarking the resulting architecture against every tool that already exists. But it's honestly not launch-ready: zero working product code, a sample size of one audited report, and no real adoption path inside an actual firm yet. The strongest answer in an interview room right now — not yet something to pitch to Deloitte's leadership. The role-play exercise below is the honest answer to what closing that gap would actually require.

🧩 Which feature is used at which step

FeatureUsed at
Citation Graph BuilderRight after upload, before anything else runs — the one stage that alone would have caught the real Deloitte gap (structural count mismatch)
Track A / B / C forkImmediately after the citation graph — decides whether a claim can ever be tested for fabrication at all, so the system can't overclaim "hallucination" where the honest label is "unverifiable"
12-specialist roster + routerPer citation, after classification — only 2–5 of 12 specialists actually fire, chosen by claim type ($ figure, quote, chart, legal reference…)
Self-hosted Patronus Lynx / VectaraThe one point actual draft text leaves the parsing layer (content-match, framing-fidelity) — run in-house so a confidential draft never hits a public endpoint
Review QueueWhenever a verdict comes back Suspicious or Pending — nothing uncertain is ever auto-closed
Governance Policy EngineLast, before Output — pure rules deciding publish / hold / review against the firm's own coverage threshold
Post-Publication Monitoring + Cross-Report LibraryAfter a report ships — re-checks currency/existence on a schedule and surfaces patterns across a firm's whole publication history
5-phase execution plan (the role-play exercise)Maps every feature above to the actual org phase — Diagnostic → Pilot → Scale → Embed → Industry leadership — it would ship in inside a real company

Full research log — the Deloitte/EY/KPMG timeline, the India-specific pattern (Supreme Court, Bombay HC, tax tribunals), what governments actually require before an AI platform can launch, and the vendor-diligence checklist this thesis was tested against — lives in the case studies list.

Read the full research log →
🧭
Deloitte PM Role-Play — A 5-Year Execution Plan
🎭 Practice exercise · not a real engagement · started 14 Aug 2026

The natural next question after the research above: if I actually owned this problem at Deloitte, what's the real plan? This is a structured rehearsal exercise built directly on the findings in The Verification Gap — a full 5-phase roadmap mapped team-by-team and decision-by-decision, explicitly labeled as practice, not a claim of real Deloitte involvement.

5 phases, ~2.5–4 years, mapped team-by-team and decision-by-decision Split into what's outsider-doable vs. only possible once hired 4 concrete plans, each with a realistic tentative timeline
Read the execution plan →
06

Skills & Toolkit

// what I bring on day one

Solid chips are proven on the job. Dashed chips are current tools I'm actively building fluency in.

🎯

Strategy & Prioritization

Product Strategy Product Roadmap Product Life Cycle Management OKRs
⚙️

Execution

Agile Scrum Sprint Planning JIRA Azure DevOps Partner Onboarding Commission Engines Linear Notion
📊

Data & Experimentation

SQL Power BI Salesforce CRM Amplitude Mixpanel
🔧

Technical Fluency

eKYC Account Aggregator RBI Digital Lending Guidelines Finacle API Integration Postman Python Linux WireShark REST APIs System Design GDS (Amadeus/Sabre) Travel APIs Zapier Airtable
🤖

AI & Agentic Tools

Agentic AI Claude Code Claude ChatGPT Perplexity Cursor GitHub Copilot Notion AI
✍️

Communication

PRD Writing User Stories Stakeholder Management Confluence Miro Slack

AI Tools I Actually Use

Breadth across the PM workflow, not just visual generation. Solid text is proven daily use; dashed tools are best-in-class picks I'm actively folding in.

Workflow stageTool(s) usedWhat it's used for
Research & synthesis Claude, PPerplexity Pulling market/competitive context and synthesizing it into a structured brief before writing a PRD or case study.
Writing (PRDs, memos, specs) Claude, NNotion AI First-draft PRDs, exec updates, and journal write-ups, organized in Notion, then edited for accuracy and voice.
Prototyping / coding Claude Code, Cursor Scaffolding real prototypes and shipping small builds end-to-end (like this portfolio site), well past throwaway mockups.
Visual/design generation FFigma AI GGamma AI-assisted iteration on design work in Figma, and turning a rough brief into a polished stakeholder deck in Gamma instead of a blank slide.
Meeting notes & transcription OOtter.ai Transcribing and summarizing stakeholder syncs so nothing said in a meeting gets lost by the next standup.
Data analysis Claude, SQL, PPower BI Drafting and checking KPI queries, then turning Power BI/Salesforce reports into a plain-English readout for stakeholders.
Project/task orchestration Claude, NNotion Orchestrating research, PRD drafting, tickets, and architecture in a single AI-assisted pass, with Notion as the shared source of truth.
07

Resume

// download
Bhawna_Mangla_Resume_2026.pdf
Last updated: September 2026
Download resume Email instead
08

Recommendations

// from LinkedIn
"Clarity of thought and quality results is what you get with Bhawna. Rare person with good listening skills and focused approach. Product management and stakeholder relations is her forte."
Prasanna Jain — 21+ yrs, Product & Strategy · senior to Bhawna, no direct management · LinkedIn, Nov 2023
"Bhawna has an exceptional ability to manage teams and projects effortlessly while maintaining clarity, structure, and a positive work environment. She balances deadlines, client expectations, and team dynamics with remarkable ease… I highly recommend her for her professionalism, leadership, and outstanding project management skills."
Janvi Gulati — UI/UX Designer · worked with Bhawna, different teams · LinkedIn, Feb 2026
"Bhawna takes initiative and leads projects confidently. She doesn't wait to be told what needs to be done — she anticipates needs, offers creative solutions, and keeps projects moving forward smoothly. She is also an excellent communicator, making collaboration easy. Bhawna is an invaluable asset to any team, combining strong design skills with reliability, leadership, and a positive attitude."
Allison Crochet — Social Media Project Manager, Smartsites · worked with Bhawna, different teams · LinkedIn, May 2026
"I have worked with many professionals throughout my journey, but Bhawna was a unique one to work. Her work ethics are pristine, and she is easily adjustable to a given situation, ability to go out of her way to help others has made her stand out."
Bhupender Rana — Telecom / Networking · direct manager · LinkedIn, Apr 2022
10

Let's Talk

// open to Senior PM roles

Sent directly to my inbox; nothing is stored beyond that.

Bhawna Mangla smiling outdoors on a skybridge

Let's build something
worth shipping.